import numpy as np
import pandas as pd
import matplotlib.pyplot as plt
from numpy.polynomial import polynomial as P64 Optimal nitrogen rate
Keywords
nitrogen, fertilizer, optimal application
Dataset description: Fertilized corn crop in Nebraska.
Corn Trial conducted jointly with Dennis Francis and Jim Schepers, USDA-ARS, University of Nebraska, Lincoln, NE. Corn trial located near Shelton, NE. Harvested in October, 2003
Source: http://www.nue.okstate.edu/Nitrogen_Conference2003/Corn_Research.htm
# Define auxiliary function for computing the root mean squared error (RMSE)
rmse_fn = lambda obs,pred: np.sqrt(np.mean((obs - pred)**2))
# Fit polynomial: Example using yield responses to nitrogen rates
yield_obs = [118, 165, 170, 193, 180, 181, 141, 177, 165, 197, 175] # Corn yield
nitrogen_obs = [0, 89, 161, 165, 80, 160, 37, 105, 69, 123, 141]# Visualize field observations
plt.figure(figsize=(5,4))
plt.scatter(nitrogen_obs, yield_obs, facecolor='w', edgecolor='k')
plt.xlabel('Nitrogen rate (kg/ha)')
plt.ylabel('Yield rate (kg/ha)')
plt.show()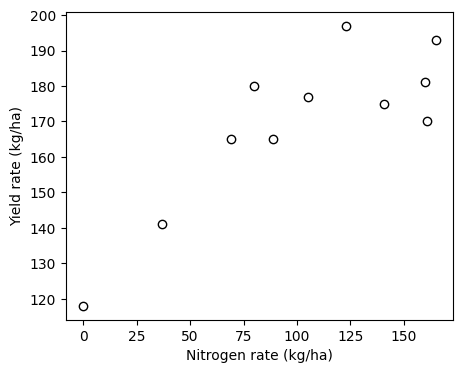
# Fit polynomial model
par = P.polyfit(nitrogen_obs, yield_obs, 2)
print(par)

# Use P.polyval? to access function help
[ 1.15569115e+02 9.61329119e-01 -3.41221057e-03]# Compute fitting error
# Compute
yield_pred = P.polyval(nitrogen_obs, par)
rmse = rmse_fn(yield_obs, yield_pred)
print(round(rmse,1),'kg/ha')8.4 kg/ha# Compute fitted curve
N_min = np.min(nitrogen_obs)
N_max = np.max(nitrogen_obs)
nitrogen_curve = np.linspace(N_min, N_max, 50)
yield_curve = P.polyval(nitrogen_curve, par)# Find index at which yield in the nitrogen curve is highest
idx_yield_max = np.argmax(yield_curve)
# Use the index to retrieve the optinal nitrogen rate at which yield is maximum
N_opt = nitrogen_curve[idx_yield_max]
# Find min and max yield
Y_max = np.max(yield_curve)
Y_min = np.min(yield_curve)
print(f'The optimal N rate is {N_opt:.1f} kg/ha')The optimal N rate is 141.4 kg/haWe can also find the optimal Nitrogen rate by approximating the first derivative of the function. Note that np.diff() will return an array that is one-element shorter.
idx = np.argmin(np.abs(np.diff(yield_curve, 1)))
nitrogen_curve[idx+1]
# Visualize field observations
plt.figure(figsize=(5,4))
plt.scatter(nitrogen_obs, yield_obs, facecolor='w', edgecolor='k', label='Observations')
plt.plot(nitrogen_curve, yield_curve,
color='tomato',linestyle='dashed', linewidth=2, label='Fit')
plt.axvline(N_opt, color='k')
plt.xlabel('Nitrogen rate (kg/ha)')
plt.ylabel('Yield rate (kg/ha)')
plt.legend()
plt.show()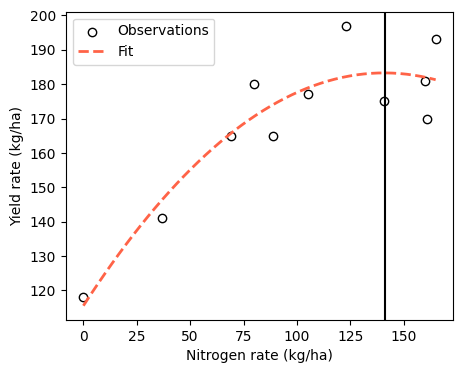
Analytical solution
We can also use the Sympy module in Python to solve the equation analytically (exact solution). Remember that the optimal nitrogen rate is when yield no longer responds to additional nitrogen fertilizer. Thus, the optimal nitrogen rate occurs when the rate of change of yield as a function of nitrogen rate is zero.
# Import sympy module
from sympy import symbols, diff, solve, lambdify
# Define the variable and coefficients of the quadratic polynomial
x = symbols('x')
a, b, c = symbols('a b c')
# Define the quadratic polynomial
polynomial = a + b*x + c*x**2
# Compute the first derivative of the polynomial with respect to x
first_derivative = diff(polynomial, x)
# Solve for x where the first derivative equals zero
# Solve accepts: a single Expr or Poly that must be zero
solution = solve(first_derivative, x)
print(solution)[-b/(2*c)]# Convert symbolic solution into lambda function
fun = lambdify((b,c),solution)# Call the new lambda function with b and c coefficients as inputs
fun(par[1],par[2])[140.86603077026513]The above answer represents the exact optimal nitrogen rate. THe value that we obtained earlier using the yield curve is very close to this value.