# Import modules
import numpy as np
import pandas as pd
import matplotlib.pyplot as plt
from scipy.optimize import curve_fit
from pprint import pprint70 Soil moisture drydowns
Keywords
soil moisture, drydown, exponential decay
Soil moisture drydowns refer to the rate at which soil loses its moisture content over time, typically following a rainfall event. The initial rate of moisture loss is typically rapid, slowing down as the soil reaches a lower moisture content. Thus, this process is often described by an exponential decay model.
In this exercise we will extract drydown events from a time series of rootzone soil moisture. Basically, a drydown represents the period of moisture loss between precipitation events. Since in this region small rainfall events don’t usually contribute to appreciable soil moisture recharge, we will set a tolerance level to ignore small rainfall events.
Model description
SWC = A \ e^{-t/\tau} + \theta_{res}
SWC = Soil water content in m^{3}/m^{3}
A = The initial soil water content m^{3}/m^{3}. Soil water at time t=0
t = Days since rainfall event
\tau = Constant that modulates the rate at which the soil dries
\theta_{res} = Residual soil water content m^{3}/m^{3}.
# Define model using an anonymous lamda function
model = lambda t,tau,A,S_min: A * np.exp(-t/tau) + S_min
xrange = np.arange(30)
# Create figure with example drydowns
plt.figure(figsize=(5,4))
# Rapid decay. Typical of summer, coarse soils, and actively growing vegetation
plt.plot(xrange, model(xrange,5,70,50), color='green')
# Drydowns during moderate atmospheric demand (spring and fall)
plt.plot(xrange, model(xrange,20,70,50), color='tomato')
# Drydown during low atmospheric demand (winter)
plt.plot(xrange, model(xrange,100,70,50), color='navy')
plt.xlabel('Days since last rainfall')
plt.ylabel('Storage (mm)')
plt.show()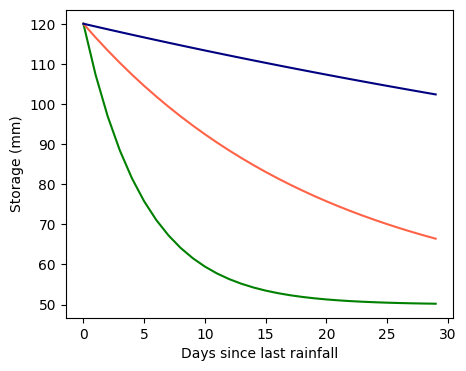
Load dataset
# Load data
df = pd.read_csv('../datasets/kings_creek_2022_2023_daily.csv',parse_dates=['datetime'])
df.head()| datetime | pressure | tmin | tmax | tavg | rmin | rmax | prcp | srad | wspd | wdir | vpd | vwc_5cm | vwc_20cm | vwc_40cm | soiltemp_5cm | soiltemp_20cm | soiltemp_40cm | battv | discharge | |
|---|---|---|---|---|---|---|---|---|---|---|---|---|---|---|---|---|---|---|---|---|
| 0 | 2022-01-01 | 96.838 | -14.8 | -4.4 | -9.60 | 78.475 | 98.012 | 0.25 | 2.098 | 5.483 | 0.969 | 0.028 | 0.257 | 0.307 | 0.359 | 2.996 | 5.392 | 7.425 | 8714.833 | 0.0 |
| 1 | 2022-01-02 | 97.995 | -20.4 | -7.2 | -13.80 | 50.543 | 84.936 | 0.25 | 9.756 | 2.216 | 2.023 | 0.072 | 0.256 | 0.307 | 0.358 | 2.562 | 4.250 | 6.692 | 8890.042 | 0.0 |
| 2 | 2022-01-03 | 97.844 | -9.4 | 8.8 | -0.30 | 40.622 | 82.662 | 0.50 | 9.681 | 2.749 | 5.667 | 0.262 | 0.255 | 0.307 | 0.358 | 2.454 | 3.917 | 6.208 | 8924.833 | 0.0 |
| 3 | 2022-01-04 | 96.419 | 0.1 | 8.6 | 4.35 | 48.326 | 69.402 | 0.25 | 8.379 | 5.806 | 2.627 | 0.363 | 0.289 | 0.319 | 0.357 | 2.496 | 3.754 | 5.842 | 8838.292 | 0.0 |
| 4 | 2022-01-05 | 97.462 | -11.1 | -2.2 | -6.65 | 50.341 | 76.828 | 0.00 | 5.717 | 4.207 | 1.251 | 0.126 | 0.313 | 0.337 | 0.357 | 1.688 | 3.429 | 5.567 | 8848.083 | 0.0 |
# Convert date strings into pandas datetie format
df.insert(1, 'doy', df['datetime'].dt.dayofyear)
# Compute soil water storage in top 50 cm
df['storage'] = df['vwc_5cm']*100 + df['vwc_20cm']*200 + df['vwc_40cm']*200# Plot timeseries of soil moisture and EDDI
plt.figure(figsize=(8,3))
plt.plot(df['datetime'], df['storage'], color='k', linewidth=1.0)
plt.ylabel('Soil water storage (mm)')
plt.twinx()
plt.plot(df['datetime'], df['prcp'], color='tomato', linewidth=0.5)
plt.ylabel('Precipitation (mm)', color='tomato')
plt.show()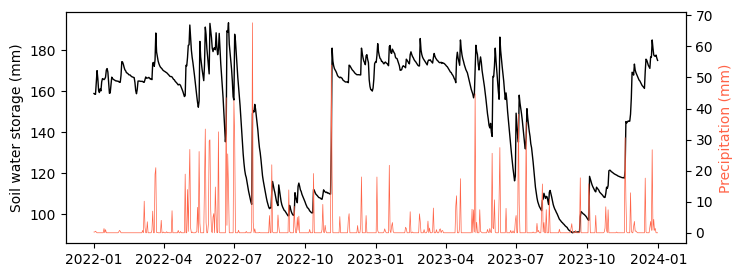
# Find residual volumetric water content
storage_min = df['storage'].min()
print(storage_min)

# Define model by forcing minimum storage
model = lambda t,tau,A: A * np.exp(-t/tau) + storage_min90.80000000000001# Iterate over soil moisture timeseries to retrieve drydowns
day_counter = 0
drydown_min_length = 7
all_drydowns = []
drydown_event = {'date':[],'storage':[],'doy':[],
'days':[],'length':[], 'par':[]}
# We start the loop on the second day
for i in range(1,len(df)):
delta = df["storage"][i] - df["storage"][i-1]
if delta < 0:
day_counter += 1
drydown_event['date'].append(df.loc[i,'datetime'])
drydown_event['storage'].append(df.loc[i,'storage'])
drydown_event['doy'].append(df.loc[i,'doy'])
drydown_event['days'].append(day_counter)
drydown_event['length'] = day_counter
else:
# Avoid saving data for short drydowns
if day_counter < drydown_min_length:
# Reset variables
day_counter = 0
drydown_event = {'date':[],'storage':[],'doy':[],
'days':[],'length':[], 'par':[]}
continue
else:
# Fit model to drydown event
par_opt, par_cov = curve_fit(model,
drydown_event['days'],
drydown_event['storage'])
drydown_event['par'] = par_opt
# Append current event
all_drydowns.append(drydown_event)
# Reset variables
day_counter = 0
drydown_event = {'date':[],'storage':[],'doy':[],
'days':[],'length':[], 'par':[]}
print('There are a total of',len(all_drydowns),'drydowns') There are a total of 34 drydowns# Inspect one drydown event
pprint(all_drydowns[2]){'date': [Timestamp('2022-04-12 00:00:00'),
Timestamp('2022-04-13 00:00:00'),
Timestamp('2022-04-14 00:00:00'),
Timestamp('2022-04-15 00:00:00'),
Timestamp('2022-04-16 00:00:00'),
Timestamp('2022-04-17 00:00:00'),
Timestamp('2022-04-18 00:00:00'),
Timestamp('2022-04-19 00:00:00'),
Timestamp('2022-04-20 00:00:00')],
'days': [1, 2, 3, 4, 5, 6, 7, 8, 9],
'doy': [102, 103, 104, 105, 106, 107, 108, 109, 110],
'length': 9,
'par': array([156.17218773, 76.60354863]),
'storage': [167.0,
166.4,
165.8,
165.60000000000002,
164.9,
164.5,
164.1,
163.6,
163.1]}Overlay soil moisture timeseries and extracted drydowns
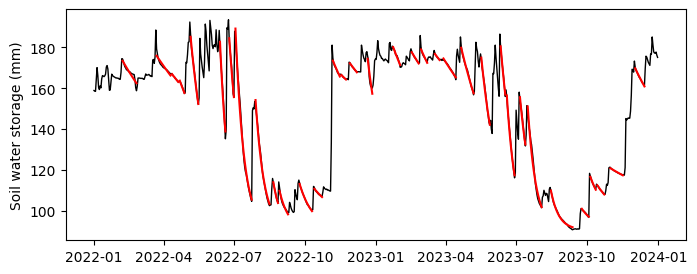
plt.figure(figsize=(8,3))
plt.plot(df['datetime'], df['storage'], color='k', linewidth=1.0)
for event in all_drydowns:
    plt.plot(event['date'], model(np.asarray(event['days']), *event['par']), '-r')

plt.ylabel('Soil water storage (mm)')
plt.show()