Additional notes
- If you just want to count objects you can ignore the RGB data.
- Image names should not contain commas.
- As long as you don't refresh the page, pixlabel will store the records for multiple images.
Examine pixel color, count objects, or simply collect lots of ground-truth color data for regression and machine learning projects.
Undo also works with Ctrl+Z / ⌘Z
Step 1
Load an image from your local hard drive or play with the example pictures.
Step 2
 Select a pixel array. A "Single pixel" means that information is recorded only for the pixel right
underneath the crosshair cursor. Depending on the application, users might be interested in knowing
the color value of neighboring pixels. So, you can also choose to record information in a 3×3, 5×5,
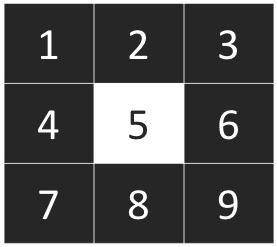
and 7×7 pixel area. The central pixel is always the pixel under the crosshair cursor. The order in
which pixels are recorded is illustrated with the 3×3 pixel area.
Select a pixel array. A "Single pixel" means that information is recorded only for the pixel right
underneath the crosshair cursor. Depending on the application, users might be interested in knowing
the color value of neighboring pixels. So, you can also choose to record information in a 3×3, 5×5,
and 7×7 pixel area. The central pixel is always the pixel under the crosshair cursor. The order in
which pixels are recorded is illustrated with the 3×3 pixel area.
Step 3
Write a label — no need to press the Enter key. You can enter anything: Andromeda, flower, soil, elfs.
Labels can have spaces. When you are done with the current label just write a new one and keep selecting pixels.
Step 4
Click on the areas of the image that represent the current label.
pixlabel will record the timestamp,
row, column, normalized row & column (0–1 scale), and RGB color values.
If you mis-click, use the Undo button (or Ctrl+Z / ⌘Z) to remove the last record.
Step 5
Download the comma-separated values (CSV) file. You can open this file with a text editor or MS Excel.
The CSV now includes COL_NORM and ROW_NORM columns with coordinates
normalized to the 0–1 range, making the data portable across different image sizes.
If you have suggestions for improvement, want to report a bug, or just want to share how you are using pixlabel, please send an email to: andrespatrignani@ksu.edu